Medallion data warehouse
Five public sources, none of which agree with each other, landed in Microsoft Fabric and refined through bronze, silver and gold into a star schema that Power BI can query without a subquery.
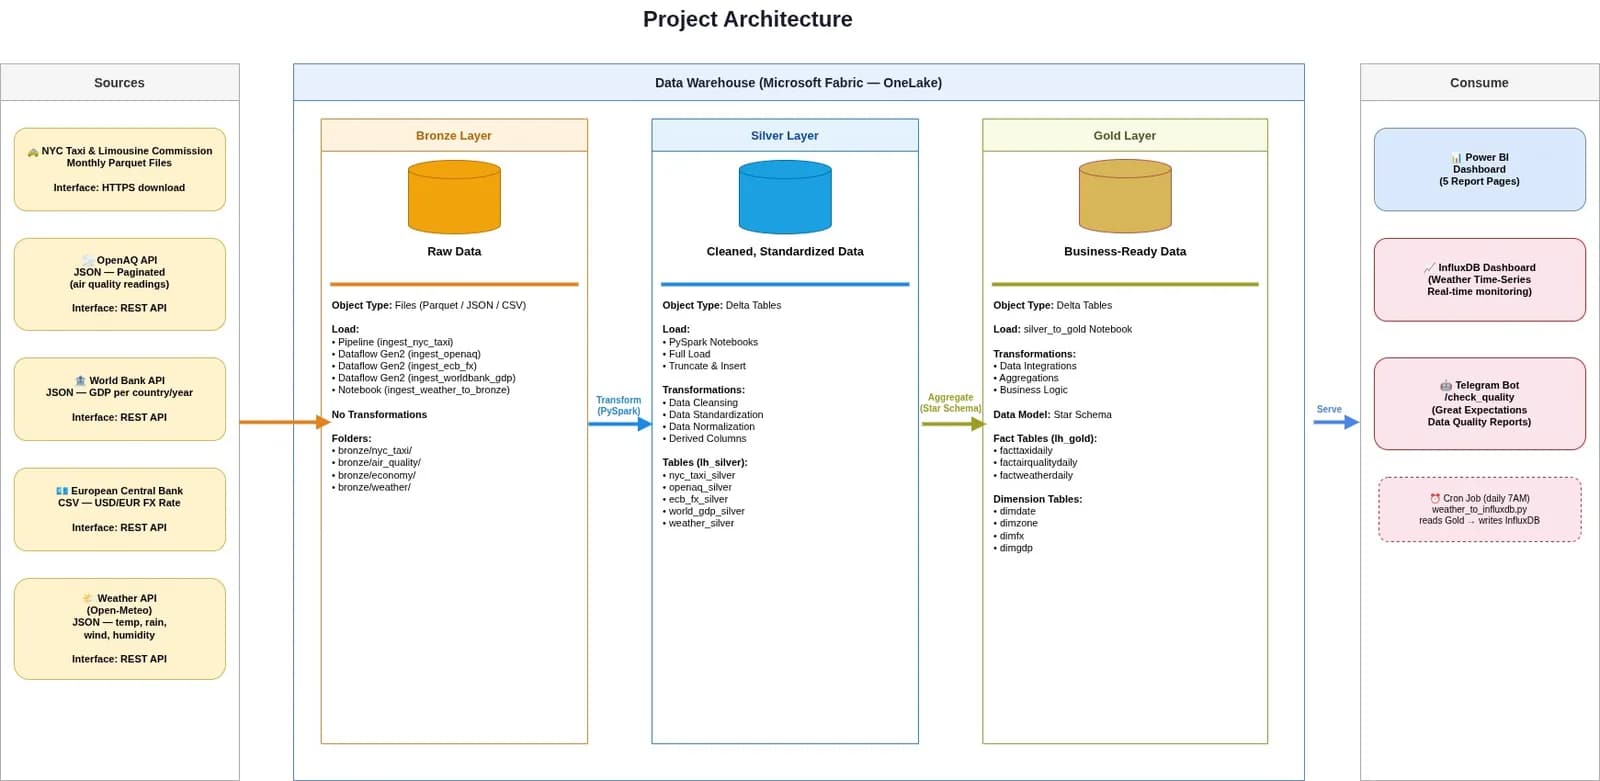
Five sources that agree about nothing
The warehouse pulls from five real public sources, deliberately chosen so they would not line up:
- NYC Taxi and Limousine Commission, monthly Parquet files over HTTPS
- OpenAQ, paginated JSON of air quality readings
- World Bank, JSON of GDP per country per year
- European Central Bank, CSV of the USD to EUR rate
- Open-Meteo, JSON of temperature, rain, wind and humidity
Different formats, different grains, different ideas about what a date is. Taxi data arrives per trip, air quality per reading, GDP once a year. Getting them into one model is the whole exercise.
Bronze keeps its mouth shut
The bronze layer stores files exactly as they arrived: Parquet, JSON and CSV, under bronze/nyc_taxi/, bronze/air_quality/, bronze/economy/ and bronze/weather/. No transformations at all.
That restraint is the point. When a number looks wrong three weeks later, bronze is the only place that can answer whether the source sent it that way or a transformation did it. A layer that "just tidies things up a little" on the way in destroys the evidence.
Ingestion is mixed on purpose, matched to each source rather than forced through one mechanism: a Pipeline for the taxi files, Dataflow Gen2 for OpenAQ, the ECB rate and World Bank GDP, and a Notebook for weather.
Silver does the arguing
Silver is Delta tables, loaded by PySpark notebooks with a truncate and insert full load. This is where cleansing, standardisation, normalisation and derived columns happen, producing nyc_taxi_silver, openaq_silver, ecb_fx_silver, world_gdp_silver and weather_silver.
Full load rather than incremental was the right call at this size. Incremental loading buys speed and costs correctness bugs, and the volume here did not need the speed.
Gold is modelled for reading
!Star schema: three daily fact tables surrounded by date, zone, FX and GDP dimensions
Three fact tables, all at daily grain: facttaxidaily, factairqualitydaily and factweatherdaily. Four dimensions around them: dimdate, dimzone, dimfx and dimgdp.
Two modelling decisions worth naming:
- Everything is conformed to daily grain. Taxi trips and air quality readings
- `dimgdp` has no foreign key. GDP is annual and country-level, so it does
dimdate carries year, month, day, month_name, day_name, day_of_week, quarter and is_weekend, so a report filters on a column instead of parsing a string at query time.
Three ways out
The gold layer feeds three consumers, which is a useful test of whether it was modelled well:
- Power BI, five report pages, built straight on gold.
- InfluxDB, for weather time series. A cron job at 07:00 runs
- A Telegram bot,
/check_quality, which returns Great Expectations data
That last one matters more than it looks. Data quality reports that live in a notebook get read once. A quality report you can ask for from your phone gets read when something looks off, which is the only time it counts.